機械学習で分類をやってみたいけど、
何から勉強したらいいかわからない。。。
という方は、ロジスティック回帰からやってみましょう。
簡単に実装できるので初心者におすすめです。
データセット
scikit-learnのデータを使いましょう。
Pythonの実行環境がない場合は、Google Colaboratoryを使うと良いです。
>>Google Colaboratoryの使い方
import pandas as pd
from sklearn.datasets import load_breast_cancer

data = load_breast_cancer()
df = pd.DataFrame(data["data"], columns = data["feature_names"])
df["target"] = data["target"]
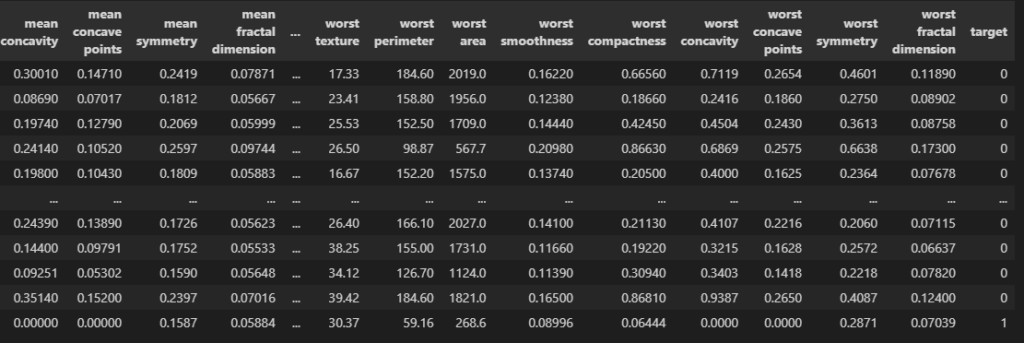
df
targetが予測したいデータです。01で分類されています。
これは医療系のデータセットで、0だと陰性、1だと陽性です。
import matplotlib.pyplot as plt

c = "mean perimeter"
plt.hist(df.loc[df.target == 0, c], label = "label_0", alpha = 0.75)
plt.hist(df.loc[df.target == 1, c], label = "label_1", alpha = 0.75)
plt.legend()
plt.show()
こんな感じで、01ごとに特徴(列)の分布が異なっています。
なので、各列の特徴を学習させて、targetが0か1かを予測させましょう。
データ分割
データを学習用と検証用にわけましょう。
モデルの精度を検証する場合は、学習時に答えを教えていないものを使います。
from sklearn.model_selection import train_test_split

train, test = train_test_split(df, test_size = 0.1)
print(train.shape, test.shape)

# ========== output ==========
# (512, 31) (57, 31)
train_test_splitで分割できます。
test_sizeを0.1にすると1割が検証用(test)になります。
features = [c for c in df.columns if c != "target"]
print(features)

#学習用データ
X_train = train[features]
y_train = train["target"].values

#検証用データ
X_test = test[features]
y_test = test["target"].values

print(X_train.shape, y_train.shape)
print(X_test.shape, y_test.shape)

# ========== output ==========
# ['mean radius', 'mean texture', 'mean perimeter', 'mean area', ...
# (512, 30) (512,)
# (57, 30) (57,)モデル作成
学習
from sklearn.linear_model import LogisticRegression

model = LogisticRegression()
model.fit(X_train, y_train)
これだけで学習が実行できます。
簡単ですね。
検証
preds = model.predict_proba(X_train)
print(preds[:5])

# ========== output ==========
# [[9.99999933e-01 6.69413576e-08]
#  [9.36861079e-01 6.31389208e-02]
#  [2.14735561e-03 9.97852644e-01]
#  [9.28606720e-03 9.90713933e-01]
#  [1.33766714e-02 9.86623329e-01]]
predict_probaで予測ができます。
出力は確率になっていて、1列目(左)がラベル0である確率、
2列目(右)がラベル1である確率です。
これだけだとわかりにくいので、図示してみましょう。
preds = model.predict_proba(X_train)
train["prob"] = preds[:, 1]#ラベル1になる確率
plt.hist(train.loc[train.target == 0, "prob"], label = "label_0", alpha = 0.75)
plt.hist(train.loc[train.target == 1, "prob"], label = "label_1", alpha = 0.75)
plt.legend()
plt.show()
青色がラベル0のデータ、橙色がラベル1のデータです。
だいたいそれぞれのラベルに近い位置に分布していますね。
ただし、モデルの精度を確かめる場合は検証データで計算しましょう。
学習データだとすでに答えを知っているからです。
preds = model.predict_proba(X_test)
test["prob"] = preds[:, 1]
plt.hist(test.loc[test.target == 0, "prob"], label = "label_0", alpha = 0.75)
plt.hist(test.loc[test.target == 1, "prob"], label = "label_1", alpha = 0.75)
plt.legend()
plt.show()
検証データでもいい感じに分類できてそうですね。
ヒストグラムだけではわかりにくいので、正解率も計算してみましょう。
from sklearn.metrics import accuracy_score
score = accuracy_score(y_test, preds[:, 1] > 0.5)
print(score)

# ========== output ==========
# 0.9473684210526315
正解率は94.7%でした。
簡単に分類できるデータなので精度も良かったですね。
まとめ
今回は初心者向けに、ロジスティック回帰の分類モデルを作る方法を解説しました。
fitだけで学習してくれるので意外と簡単にできますね。
ちょっと難しめのモデルに挑戦したい人はLightGBMがおすすめです。


コメント