LightGBMは簡単に作れるわりに精度が高いのでおすすめです。
今回は分類モデルを作る方法を解説します。
分類ではなく回帰をやってみたい方は以下の記事を参考にしてください。
>>LightGBMで回帰モデルを作る方法
コードをコピペするだけで実装できるので、初心者でも大丈夫です。
データセット
そもそも勉強に使うデータを持っていない人は、scikit-learnに入っているものを使いましょう。
Python実行環境がない場合はGoogle Colaboratoryを使うといいです。
>>Google Colaboratoryの使い方
import pandas as pd
from sklearn.datasets import load_breast_cancer

data = load_breast_cancer()
df = pd.DataFrame(data["data"], columns = data["feature_names"])
df["target"] = data["target"]
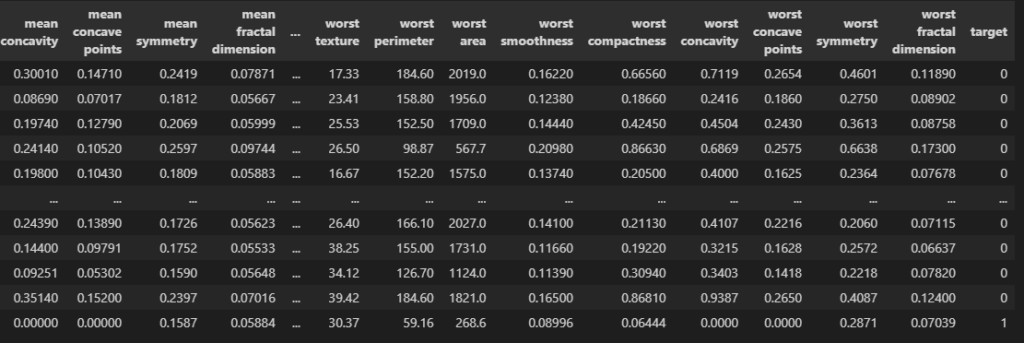
df
targetが01の2種類になっています。
load_breast_cancerは医療系のデータセットで、0だと陰性、1だと陽性です。
import matplotlib.pyplot as plt

c = "mean perimeter"
plt.hist(df.loc[df.target == 0, c], label = "label_0", alpha = 0.75)
plt.hist(df.loc[df.target == 1, c], label = "label_1", alpha = 0.75)
plt.legend()
plt.show()
例えばこのようにmean perimeterはtargetが0か1かで分布が異なります。
全部の特徴を学習させてtargetがどちらかを分類するモデルを作りましょう。
データ分割
from sklearn.model_selection import train_test_split

train, test = train_test_split(df, test_size = 0.1)
print(train.shape, test.shape)

# ========== output ==========
# (512, 31) (57, 31)
データを学習用と検証用とにわけます。
検証用データ(test)はモデルの精度を確かめるときに使います。
features = [c for c in df.columns if c != "target"]
print(features)

#学習用データ
X_train = train[features]
y_train = train["target"].values

#検証用データ
X_test = test[features]
y_test = test["target"].values

print(X_train.shape, y_train.shape)
print(X_test.shape, y_test.shape)

# ========== output ==========
# ['mean radius', 'mean texture', 'mean perimeter', 'mean area', ...
# (512, 30) (512,)
# (57, 30) (57,)こんな感じで4つのデータに分けられたらOKです。
モデル作成
import lightgbm as lgbm

# データ形式の変換
train_set = lgbm.Dataset(X_train, y_train)
test_set = lgbm.Dataset(X_test, y_test)

# パラメータ設定
params = {"objective": "binary", # 2値分類
          "verbosity": -1}       # warningなどを出力しない

# 学習
model = lgbm.train(
    params = params,
    train_set = train_set,
    valid_sets = [train_set, test_set],
    callbacks = [lgbm.callback.log_evaluation(10)],
)
loglossというのが誤差です。徐々に小さくなっていればOKです。
予測結果
preds = model.predict(X_train)#ラベル1になる確率
train["prob"] = preds
plt.subplot(1, 2, 1)
plt.hist(train.loc[train.target == 0, "prob"])
plt.title("label_0")
plt.subplot(1, 2, 2)
plt.hist(train.loc[train.target == 1, "prob"])
plt.title("label_1")
plt.show()
predictでラベル1になる確率を予測してくれます。
ヒストグラムにしていますが、ラベル0のときは確率がほぼ0、ラベル1のときはほぼ1なので、
いい感じに分類できていそうです。
ただしこれは学習データ(train)での予測で、
モデルはすでに答えを知っているので精度が良くて当然です。
なので検証データ(test)でも予測してみましょう。
preds = model.predict(X_test)#ラベル1になる確率
test["prob"] = preds
plt.subplot(1, 2, 1)
plt.hist(test.loc[test.target == 0, "prob"])
plt.title("label_0")
plt.subplot(1, 2, 2)
plt.hist(test.loc[test.target == 1, "prob"])
plt.title("label_1")
plt.show()
ラベル0のときにちょっと外していそうですね。
正解率を計算してみましょう。
from sklearn.metrics import accuracy_score
score = accuracy_score(y_test, preds > 0.5)
score

# ========== output ==========
# 0.9473684210526315
正解率は94.7%でした。いい感じですね。
特徴量重要度
学習と予測ができたのは良いものの、いったいどんな特徴(列)が重要だったのかわかりませんよね。
LightGBMは予測に役立った特徴をリストアップしてくれます。
lgbm.plot_importance(model, max_num_features = 10, importance_type = "gain")
plt.show()
こんな感じです。
worst_concave_pointsという列がラベル01の分類に大きく効いているみたいですね。
max_num_features = 10にすると上位10個が出てきます。デフォルトだと多すぎるからです。
importance_typeはgainにしましょう。
もっと詳しく重要度の可視化をしてみたい人はSHAP値を試してください。
>>SHAP値で特徴量の影響度を可視化する方法
まとめ
今回はLightGBMで分類モデルを作る方法を解説しました。
結構簡単に作れるわりに精度が良いのでおすすめです。


コメント